Benefits of Infographics:
7 Ways to Boost Your Audience
(View Full Infographic below)
You’ve got some compelling data, or some exciting statistics that you can’t wait to show the world and after messing around in excel it still looks pretty boring.
In a world where attention spans mirror that of a goldfish, how can you grab someone’s attention to get your information across? Introducing: Infographics.
What exactly is an infographic you may be asking? Infographics can be educational, entertaining, and an extremely useful tool. They “are graphic visual representations of information, data or knowledge intended to visually present information quickly and clearly” (see an example below).
Within the last decade, infographics have become very popular, with the likes of social media sites you can spread your brand and message with a click of a button. But how exactly can an infographic help and benefit you?
We have compiled a list of 7 tips, which can help you to create the perfect infographic for your audience.

1. Eyecatching

Infographics should be eye catching, colourful and naturally draw the viewer’s eye. Information should be easy to read or scan and get your message across quickly. Visual content is processed a whopping 60,000 X faster in the brain than text and 90% of info transmitted is visual. Now can you see the benefits of infographics?
2. Increase Brand Awareness

Placing your logo within your infographic will make you and your brand memorable to your audience and will help to promote your business. Reinforce your brand, consider colours, shapes, messages and your logo and you have an effective piece of brand awareness.
3. Increase Your Audience

Infographic Fact:
Traffic grows an average of 12% for businesses who use infographics.
Infographics that are designed down to a tee can have an awesome effect on your search engine optimisation in the form of link building. Businesses and bloggers that are a fan of your infographic can link back to your site if they find your infographic useful or relevant.

4. Show You're An Expert

It takes expert knowledge on your chosen topic to create an infographic. Using correct information that is relevant and good quality will show your audience that your are trustworthy and they’ll see you as an expert in your field.

5. Travel The World

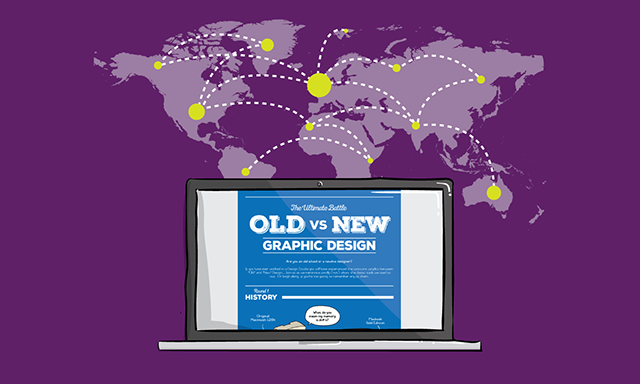
Well, your infographic at least. With social media sharing your infographic has the potential to go worldwide and reach more people. One click of a share button is all it takes for someone to spread the word about your amazing infographic and your infographic has the potential to go viral with social media. When content is shared, your profile and website are likely to get more visitors, followers and fans.
That means when you’re ready to share your next piece of content it will reach more people quicker and likely to be more credible. We recently created an infographic for Graphic Designers,The Ultimate Battle Old Vs New and in a few days we had 3.8k shares on Creative Bloq and another several hundred on other websites.
We got 7 fantastic backlinks, which will keep growing. One of the best things about infographics is they will keep getting shared and backlinked (providing they’re still relevant).

6. Increase your SEO

Engaging infographics can have a massive impact on how you rank with Google. Businesses, bloggers and the like that find your infographic relevant will more than likely use it for themselves and link back to your website.
This is great news for ranking with Google in the search results and your domain authority (strength of your site).

7. Engaging Content

We are visual beings, 70% of our sensory receptors are in our eyes and 50% of our brain is used to process visual things. Adding images to your content means people are more likely to believe what they are reading.
People are more likely to remember information with visual content.
Which means they should remember you too!

Take a Look at this!


