Data Driven Design is essential when it comes to knowing which impactful changes you need to make for your website. Without data to analyse, you’re not in a great position when it comes to deciding what you’ll need to change next - it’s all guesswork. A good way to test what is and isn’t working is to conduct an A/B test and when it comes to Data Driven Design, testing your CTAs is a great place to start. Here’s how you can do it yourself in HubSpot.

An A/B test can help you to measure the effectiveness of different designs and text in your CTAs. By switching them up slightly, you’ll know exactly what is and isn’t working - so you can stick with the variation that is producing the results.
Before we show you how to set it up, remember this key tip. When you’re conducting an A/B or multivariant test, only change one thing. If you’re making a handful of changes then you won’t know exactly which adjustment did the trick and started producing the results.
How to Set Up an A/B Multivariant Test
1. Load up Your List of CTAs
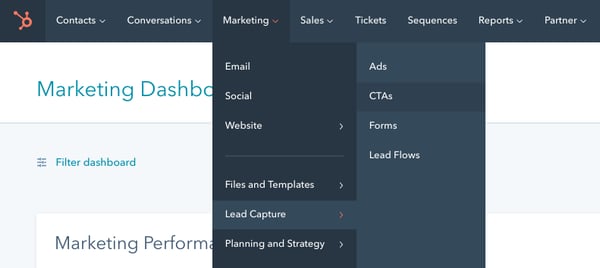
Head over to your HubSpot Dashboard. On the main navigation bar, hover over Marketing and then head down to Lead Capture. When the sub-menu pops up, click on CTAs.
2. Create an A/B Variation Test
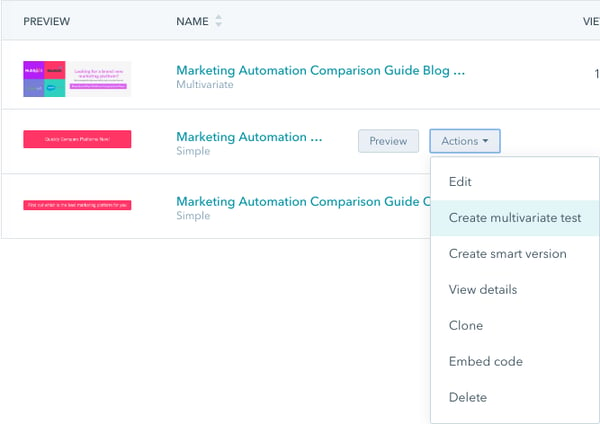
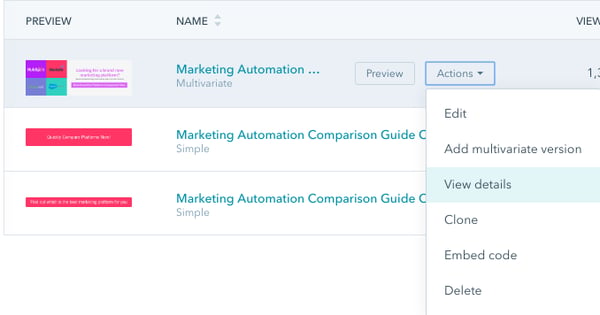
Once your lists of CTAs have appeared, search for the one you want to test. Once you’ve found your CTA, hover over it and click on the Actions button. In the drop-down menu, click create multivariate test.
3. Edit Your Variation
Once you’ve clicked on create multivariate test, HubSpot’s CTA editor will pop-up on the right-hand side of your screen. In the CTA editor, make the changes you want to the variation design.
Again, only change one variable between both versions so you can determine which factor caused more visitors to respond to your CTAs. Check out our examples below.
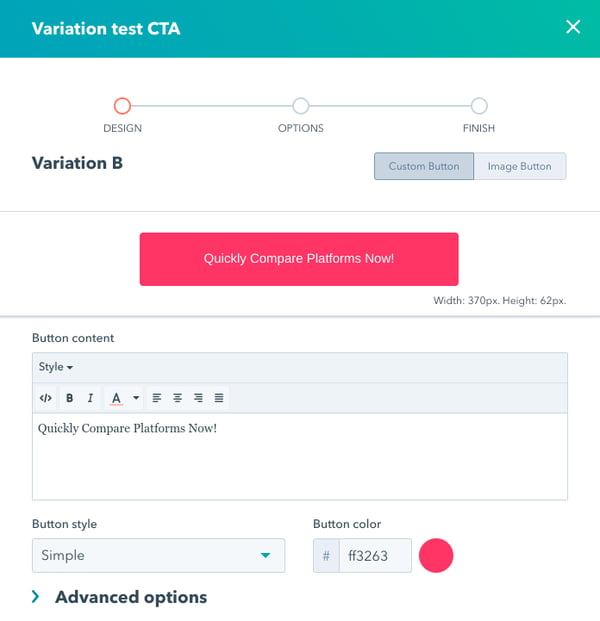
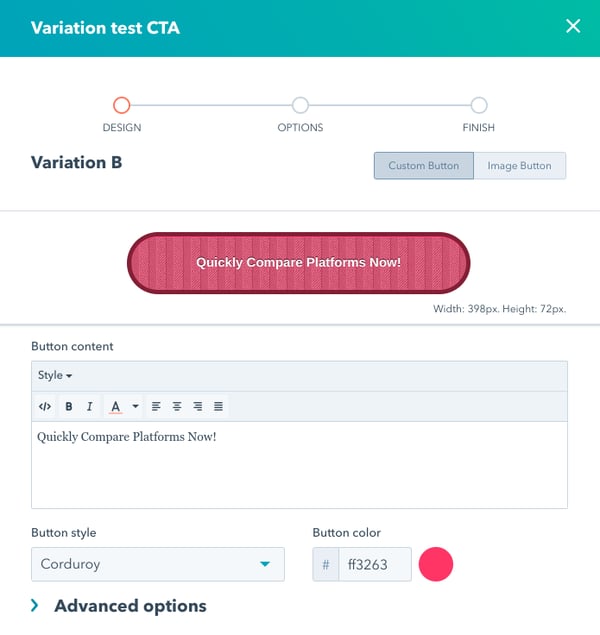
The factor we’ve changed is the button style. The original CTA is a ‘simple’ button and in this example, we’ could test out the ‘Corduroy’ button style instead. Again, this is just one of the many factors you can change - as you’ll be able to see in the next step with another example.
Once you’ve finished editing, click Next. Press Save when you’re in the Options screen before clicking either Finish or Add another variation if you want to test more than two versions of your CTA.
4. Check Out Your CTA Variations
Once you’ve pressed Save, head on over back to your CTA Dashboard. You’ll now see the original CTA labelled as a Multivariate and to check out both variations, click the Preview button.

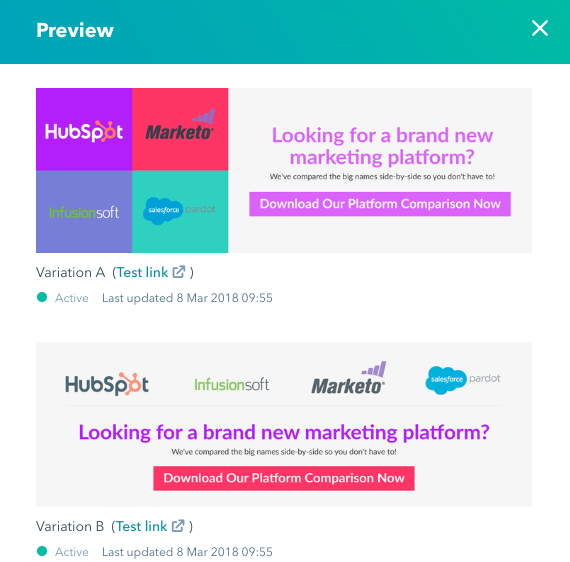
Rather than showing you a comparison of two CTAs that are shaped differently, check out the below example instead. You’ll be able to see the big design change that has been made to the CTA. The text is the same, the logos are still there - the layout, though, is different.
5. Measure the Results of Your A/B Variation Test
Don’t just rush into measuring the results of your test the next day. Give it time and let it run long enough in order to get plenty of views. HubSpot recommends that 100 views for each CTA usually makes for an accurate test. So, patience is key especially if you’ve changed one variable.
When you are at the stage to measure the results, head back to your CTA dashboard, click on Actions and then View details.
Once you’ve clicked that, you’ll be able to see the analytics for your A/B variations on the details screen. You’re able to toggle between Views, Clicks and Submissions by using the drop-down menu in the top-left corner and see the graph change to reflect the results of your test.
6. Take Action Based on Your Results
After analysing your results and seeing which CTA variation performed the best, complete the test by disabling the CTA that received the lowest Views > Clicks percentage.
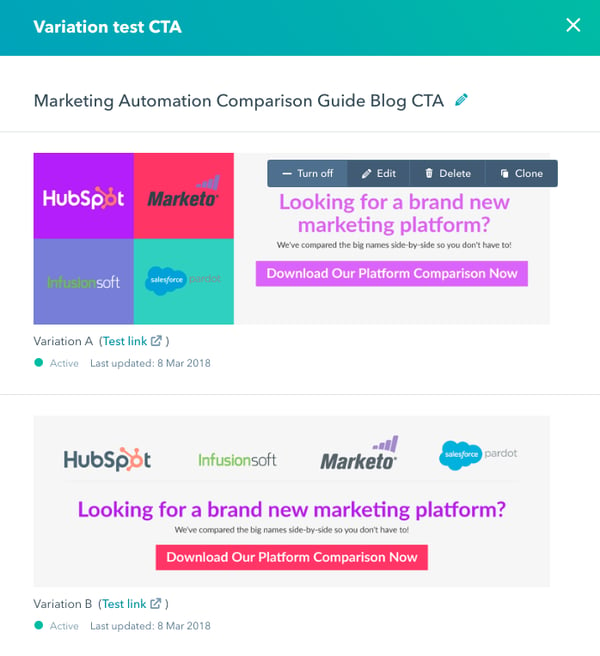
To disable a variation in the CTA Dashboard, click Actions and then Edit. Hover over the variation you want to delete and click - Turn off. Once that’s done, click Finish but if you want to fully remove the variation then press Delete before clicking Finish.
In our example, variation B proved to be the most successful so variation A can be turned off if the test is over.
And it’s as easy as that. Once you’ve turned off or deleted a variation, your A/B variation test process is complete. Now you can go ahead and dive into your own tests, or check out some of our tips on factors you can test to help with Data Driven Design.
Tips on What to Test
As we mentioned earlier in the blog, there’s not just one variation you can measure during an A/B variation test. Although it’s recommended that you only test one factor at a time, the factor in question can be anything you think will make a difference to the rate of visitors interacting with it.
Design: When focusing on Data Driven Design, the majority of marketers tend to test the design of the CTA. This includes the size by changing the dimensions, switching up the colour that’s used or even simplifying it.
Wording: It can also be worth testing actionable text that’s placed on your CTA. For example, begin your trial vs. start your free trial now might be enough for you to eventually see which variation works. So, you can also play around with wording in the A/B variation test.
Placement: This is a tricky one as it can only happen once your CTA is created, the test is complete and you know which CTA you’ll be using forward. Consider the placement of your CTAs across a campaign of blogs. Start off the trial by using the CTA at the bottom, then change it to the top and then the middle. Use that mixture to see what’s working best for your industry.
With these tips in mind, you’re in a much better position to head over to HubSpot and confidently begin A/B testing with ease.
Learn More About the World of Inbound Marketing
A/B testing is the perfect example of how Inbound Marketing is a perfect tool for Data Driven Design. It’s all about improving your website and marketing campaigns to drive optimal results. Now that you know how to A/B test, there’s still plenty more to learn in the world of Inbound Marketing and you can use HubSpot to boost your results.
We’ve made it much easier for you to digest all of this Inbound Marketing knowledge by creating an easy-to-read guide. While that’s receiving the final touches to make it ready for you to download, why not join our private Facebook Group for all things Inbound Marketing? Click on the link below to join.
.jpg?width=375&height=225&name=_DSC2023%20(1).jpg)
