With your marketing team working one way and sales team another, it’s no surprise that there can be some disconnect between the two. They need to be on the same page and that’s where HubSpot’s sales reporting software is a lifesaver as it gives your teams everything they need to know about your pipeline in one place.
Need full visibility into your sales process? No problem. Here’s a look at some of our favourite sales dashboards around today and how they help you optimise your team’s routine and create amazing experiences for your prospects.
- HubSpot CRM
- Sales Hub Professional (and the Reporting Add-on)
- Our favourite sales reporting dashboards
HubSpot CRM
If you’re new to HubSpot and slick dashboards then HubSpot CRM is a great place to start. Reporting in HubSpot CRM is tailored to dashboards which basically features a collection of reports that matter to you. You can easily select the date range, customise who gets access, add or remove certain reports and loads more. On HubSpot, you can add up to 10 reports.
I know what you’re thinking - there’s a catch. Not really. HubSpot CRM includes a set of sales reports as part of the package, ready for you to use. Here’s a look at some of them.
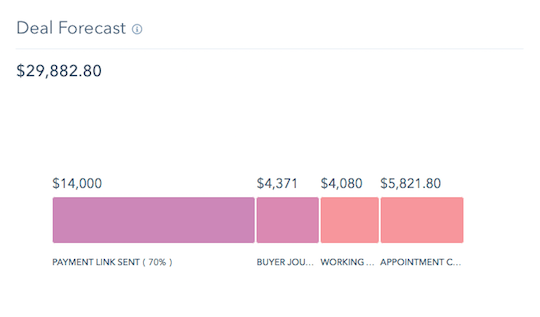
Deal Forecast
This shows the amount of revenue for deals at each stage of your pipeline. The forecast revenue is calculated by multiplying the deal amount by deal stage probability.
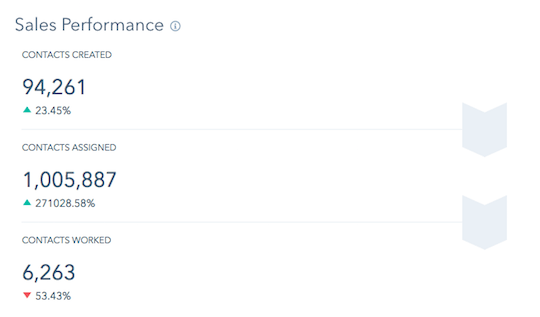
Sales Performance
Use this report to get a summary of your sales process. It shows contacts that members of your team have worked on and the number of deals created and won.
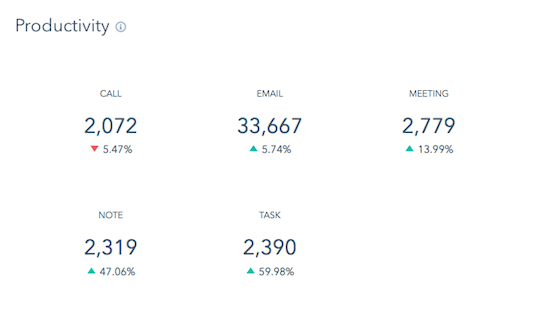
Productivity
Don’t worry, this isn’t you cracking the whip to make sure everyone is pulling their weight. This report shows the total number of calls, emails, notes, meetings and tasks your team logs in your chosen time frame.
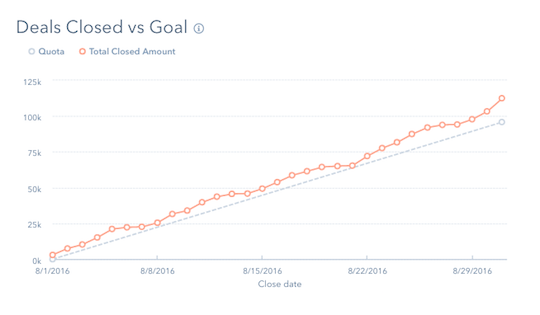
Deals Closed vs. Goal
The revenue from closed deals plotted against your team’s quote. Simple.
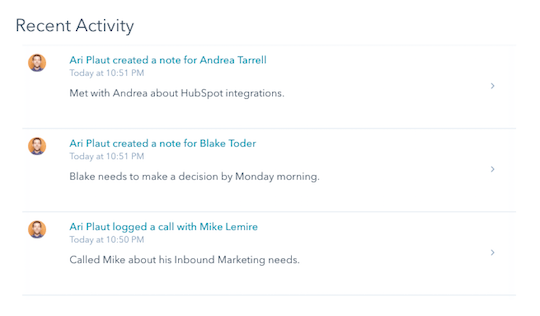
Recent Activity
An easy way to track the most recent calls, emails, meets, tasks and notes by your team.
Okay so HubSpot CRM features a lot of the basic sales reports you’ll need. Although, each team is different so you probably need something a little more detailed depending on your unique situation.
Sales Hub Professional (and the Reporting Add-on)
To get the full picture of how successful your sales team is, HubSpot’s Sales Hub Professional is well worth checking out. Combine this with the Reporting Add-on and it’s an absolute game-changer as you get access to HubSpot’s custom report builder.
That means you can create custom reports based on data that you actually care about. It’s flexible, powerful and you can tailor it to how you want. Oh, and you can create up to 200 custom dashboards as well.
Here are some of the reports you might fancy using yourself.
Leaderboard
There’s no harm in drumming up a bit of friendly competition amongst your team. They can track each other’s progress in this report to see which of them has closed the most deals.
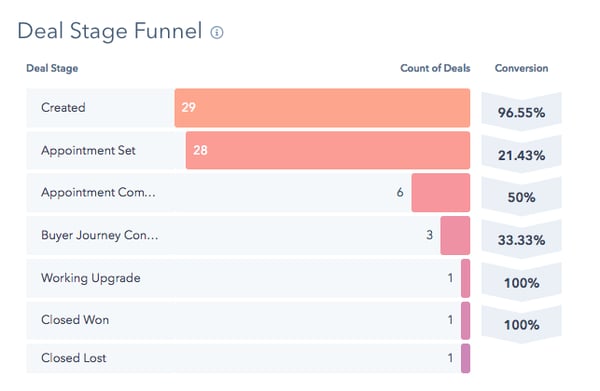
Funnels
Use this report to identify patterns in movement through your funnels to see if there are any stages where deals aren’t progressing.
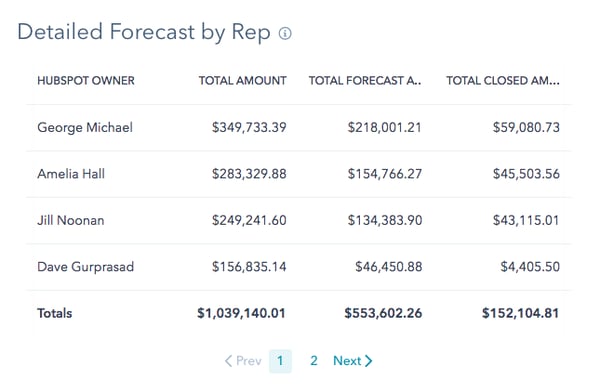
Detailed Forecasts
Need to see who has had the best month from your sales team? This report will give you that insight.
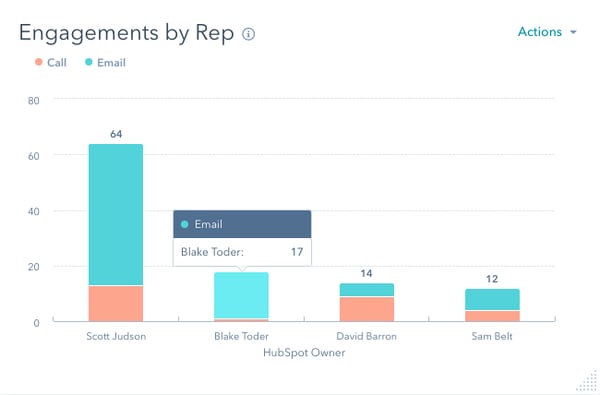
Engagements
If you’ve noticed that your sales team aren’t hitting their targets, you need to see why. Here, you can see if they’re making enough calls, sending enough emails, scheduling enough meetings and more.
The Reporting Add-on takes it up a level as you get a single, centralised home for all your marketing, sales and service data. Here’s a bit about how it can help.
- Build customisable reports in seconds: HubSpot has a useful library of commonly-used reporting templates you can use - or just create your own. Bar charts. Pie charts. Doughnut charts. Area charts. You have plenty of options and can report on virtually any metric.
- TWO HUNDRED DASHBOARDS: That’s quite a big jump from the 10 you get in HubSpot CRM. Create high-level business metrics to hone in on the ones you actually care about and dig into the granular metrics when you need to. You can even add notes to give each report some context.
- Send reports directly: You can schedule daily, weekly or monthly emails to share important dashboards so everyone can track their progress.
The Reporting Add-on is helpful for both marketing and sales teams. It combines all of your reports into one interface so that both teams can see all of the metrics they’re accountable for as well as their progress towards those goals. No more switching between multiple programs for dashboards.
Our favourite sales reporting dashboards
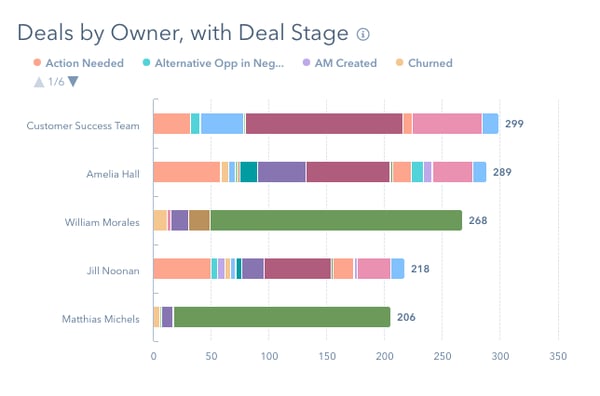
There will never be a one-size-fits-all approach to sales dashboards. Thankfully, there are plenty of dashboards out there you can use as a reference or a template to kickstart your own. Here’s a selection of some of the ones we like.
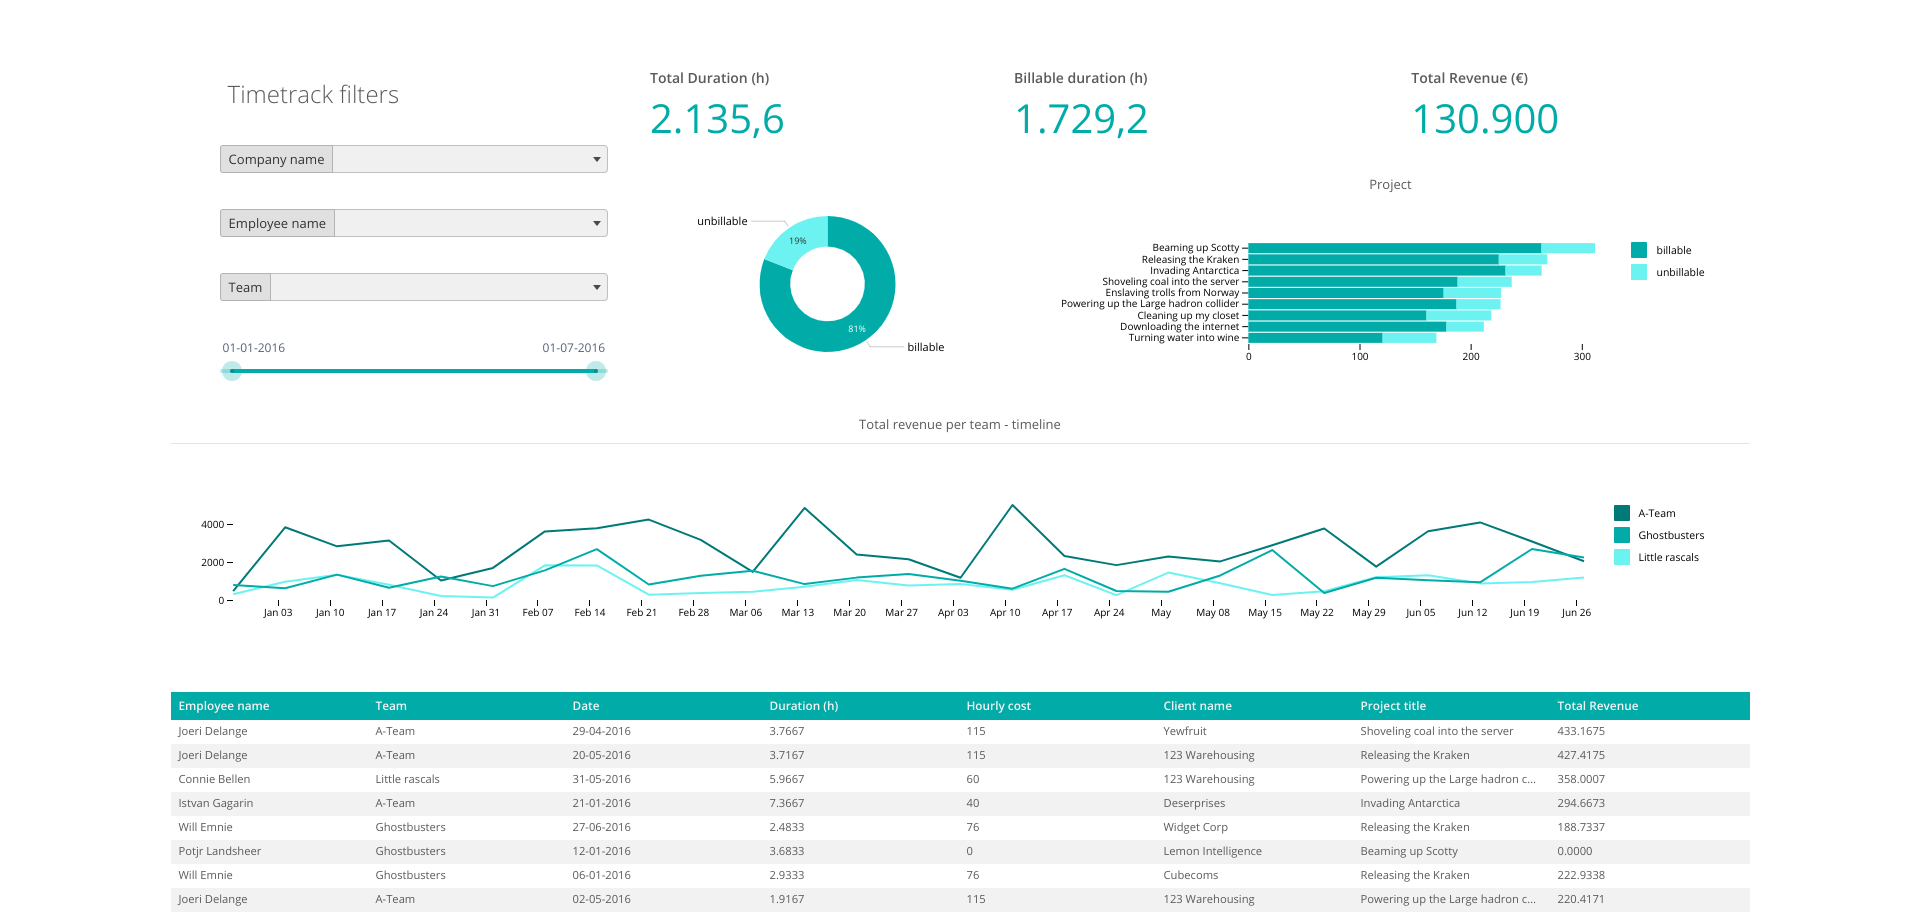
Have a team that’s always on-the-go? Not only is this dashboard pretty good to look at and easy to follow, but it also lets you see where your sales team spend their time and how much revenue they generate.
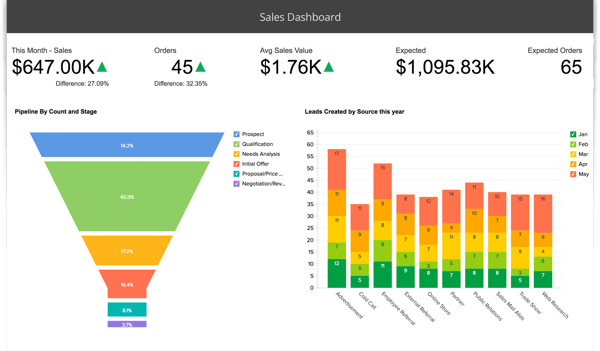
I know it can be a bit annoying having to click 281 times to get the metrics you need. Not in this case. Check out this dashboard which features the key metrics smack bang in the middle. It makes it easy to read and you’ll see the most valuable data as soon as you open it.
It’s never nice to see any deals you’ve lost but it’s still valuable insight to have. You can see why they were won or lost in the first place and then hone in on the actions that caused a deal to close or amend tactics for the ones that fell through. The dashboard below also lets you compare close rates to rates from previous periods or even industry benchmarks.
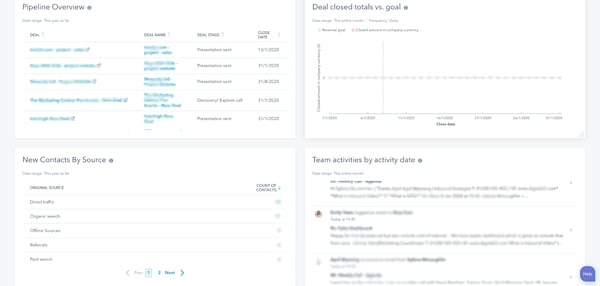
Have a look at one of ours. We use the HubSpot sales dashboard and as you can see, everything is in one place, it’s easy to understand and looks great on the eye. It just goes to show that you don’t need to overpopulate your dashboard with endless data to make it look clunky.
We’ve added plenty of reports on our custom dashboard to click on and explore further when the relevant people need to. We also have a deal forecast section to see how much revenue we expect to close. Obviously, I can’t show you that bit. Sorry.
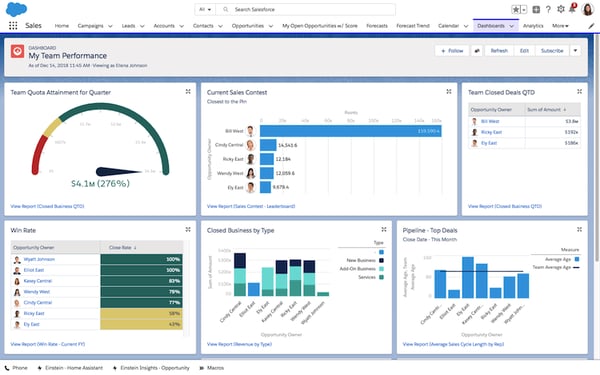
Another one we like is a sales dashboard where each member of your team can track their individual performance. The reports are nicely-sized which makes it super simple to instantly answer questions like how you’re progressing against your goals, how much you’re booking and more.
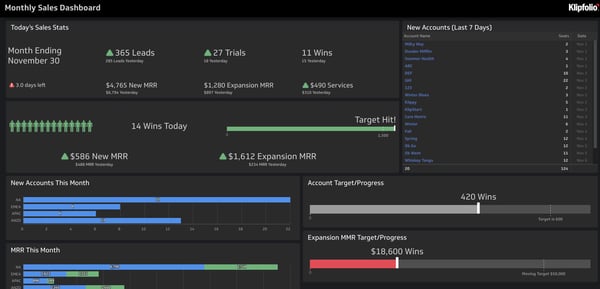
Take a look at this dashboard which provides an overview of key metrics commonly used to measure performance. It also has a little section for today’s stats which is a nice little addition and shows your monthly progress towards goals.
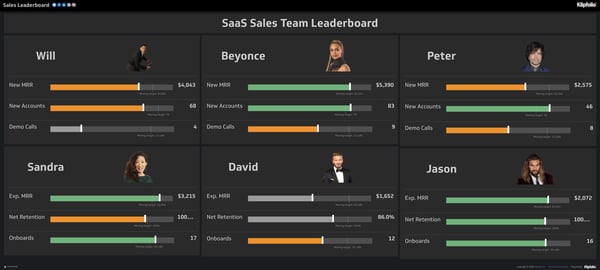
If igniting a little competition is your thing then this dashboard could be perfect for you. It’s been stripped back so it looks simple, yet still features powerful insights so you can see a leaderboard based on the number of completed activities. All those greens are looking real nice on Jason Momoa’s sales section.
This dashboard is a great example of seeing where you make the most sales and the products customers purchase the most. The insight into which territories sell the most is also a huge advantage plus it has the ability to compare metrics to previous months.
-1-1.png?width=600&name=pasted%20image%200%20(1)-1-1.png)
Chances are, you’ll find lots of dashboards to your liking online. These are just a handful of the ones we like for different reasons. Just make sure that they’re helpful to both your sales and marketing teams and you have end-to-end reporting functionality.
That bit is important. It allows your marketing team to identify what is and isn’t working as they too have the visibility, rather than shutting them out entirely. It means they can know what type of content to create based on engagement, what collateral sales might need to nudge a prospect over the edge and more.
The other added benefit of HubSpot (and your marketing team will love this) is the attribution reporting feature. This is a strategy which allows marketing and sales to see the impact marketing made on a sale. Usually after writing a blog post or developing a brilliant social media strategy, teams might have no clue of the role they played.
In some cases, it might have been their content or their social strategy which closed leads. Marketing attribution allows them to see exactly which of their actions impacted sales, allowing them to focus more on what works.
You can’t underestimate how important it is for sales and marketing to be on the same page. Having a sales dashboard that caters to both teams is a great first step towards working together with one unified goal. To close more leads with an aligned team, you’ll benefit from our sales enablement guide.