Are you one of those who know they’re doing a good job and implementing good marketing efforts for the business you’re working in, but find it difficult to show specific numbers to the management? Most people who do marketing and management know how important it is to show and measure ROI (Return on Investment). To help you get started, we've collected our 4 favourite tools.
"Of course, it's important," you may think, and there are many others who do too. However, measuring ROI in practice can be challenging (unless you have good tools).
If you have good tools available, ROI-related questions can be something you as a marketer are looking forward to answering because you can easily analyse and showcase exactly what actions have taken place.
This way, you can point to the green numbers and the initiatives that made those numbers green, which, hopefully, will open your boss’s eyes.
Here are our favourite tools:
The tools that help you show results
1) DataBox
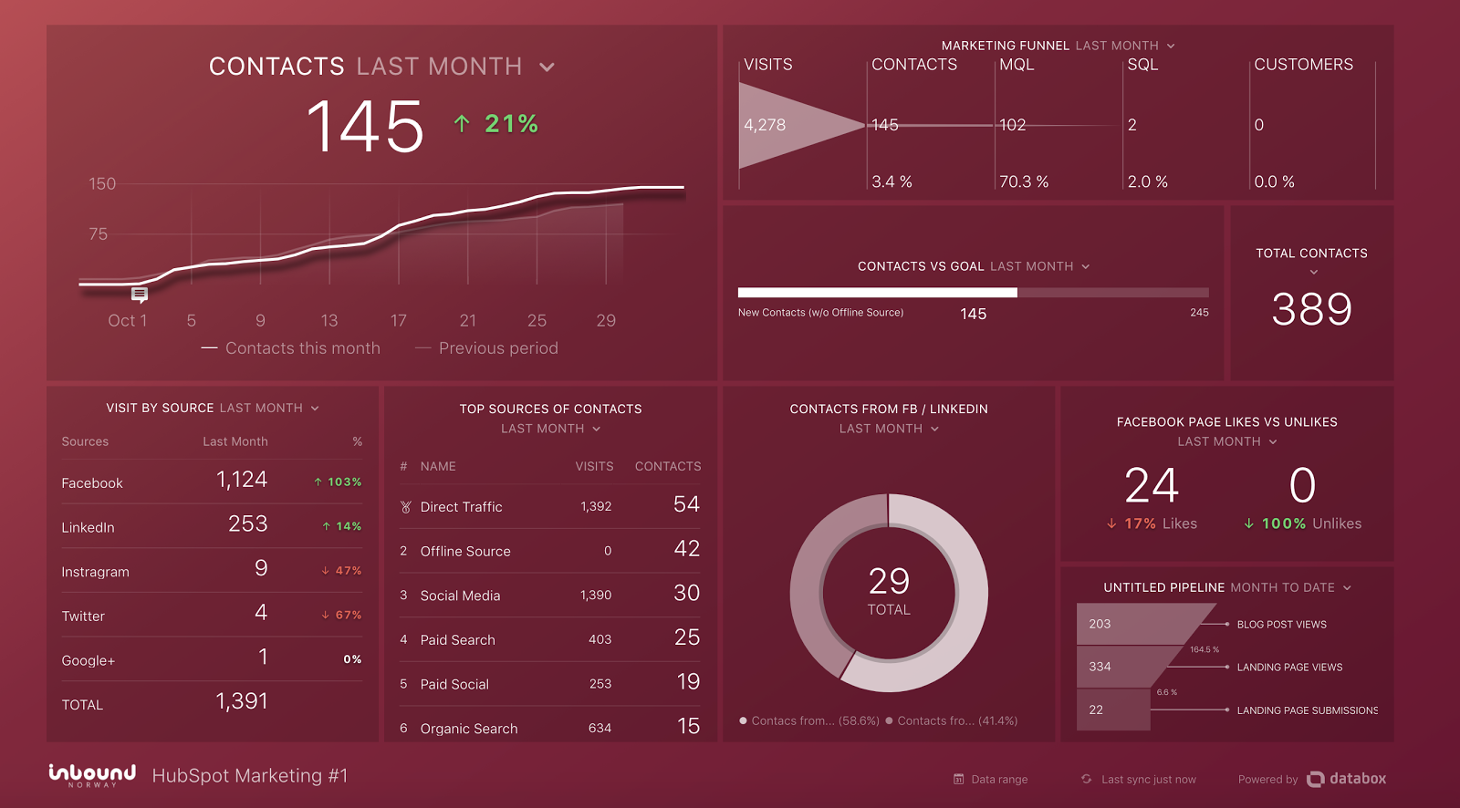
Databox gives you more opportunities to analyse and present numbers that are relevant to you and your actions, regardless of the platform to which the action is implemented. This is a perfect tool for marketers who want a better perception of what their investment in marketing actually gives in terms of results and ROI.
Why should you use Databox and how can you use it? Databox offers a variety of integrations including Google Analytics, Google Adwords, Salesforce, HubSpot, Facebook and Instagram, which allows the tool to easily retrieve numbers from these different channels and collect them in one place.
It's up to you if you want a separate dashboard for each platform, or if you want to collect some data from all platforms into a single dashboard. The opportunities are many and how you wish to present your numbers is up to you.
One thing is for sure: Databox enables you to show your boss the value of what you do in a clear, visual, and professional way.
Briefly told, Databox is an analytical KPI dashboard for businesses, where you can easily customise dashboards as you wish. The tool enables you to collect all numbers and statistics about leads, sales, and conversions in one place so that you can easily pull out and show the value of your actions.
If you would like to read more about Databox, we have made a separate blog post about it here for you to read.

2) Hubspot
For the marketer, there are many different programs for CMS, email, newsletters, blogs, social media moderation tools, analysis and market automation. Wouldn’t it be easier to assemble all this in one system?
Having systems that don’t communicate with each other makes it difficult to understand what actually works: for example, which social media posts provide the most traffic or which promotions provide the most sales qualified leads.
In HubSpot, you have the ability to integrate all your tools in one place, so you only need one login, one password, and have a complete overview of where the traffic and leads actually come from.
The possibilities in HubSpot are virtually endless and absolutely everything you associate with the tool can be analysed: What are the conversion rate on landing pages? Where does visitors and leads come from? What is the opening rate and click rate in newsletters and emails? What are the click rates on various calls-to-actions (CTA’s)?
The HubSpot analysis tool also gives you access to data that was previously available only in Google Analytics, such as the time your visitors spend on the page, and average pages viewed per visit. This means that you only need to count on a single tool to get an overview of how your marketing activities are going.
As mentioned, the possibilities in HubSpot are infinite. We at Avidly use HubSpot every single day, and will gladly answer any questions about inbound marketing and HubSpot at one of our breakfast seminars.
3) Hotjar
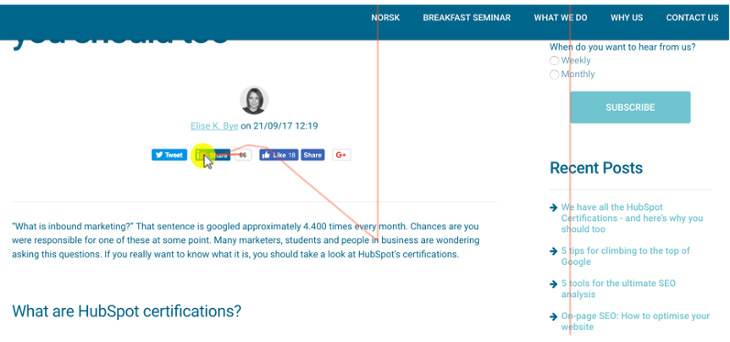
Are potential customers frantically clicking on a non-clickable text? Do you know if the change you made on the website last week actually attracts the attention you want?
Hotjar is the ultimate tool for those who want to see how potential customers actually use your website. The tool makes it easy to analyse how the page performs and help you find improvements.
In Hotjar, you will find several great features. One of them is heatmaps, giving you a full overview of what users click on, how they move the mouse and how far down the page they are scrolling. In addition to heatmaps, you will find the following functions: recording of user behaviour, conversion strings, form analysis tools, feedback polls, and a survey tool.
You can read more about Hotjar and the features provided here, or sign up for a free version here.
4) Google Analytics
.jpg?width=5472&name=google%20analytics%20(1).jpg)
Google Analytics gives you access to a multitude of reports, and you can quickly spend hours clicking around. One tip to streamline the analysis is to pick out the most important reports for your business and save them as shortcuts.
For example, Google Analytics can help you pick up site data, where you can get a response to how many visits your page gets, what share of traffic comes from mobile and which of the promotional campaigns direct visitors to the page.
These are statistics that may be particularly exciting if you work with the website, but should also play a big part in your marketing strategy.
Many think Google Analytics is scary and complicated. Therefore, we've broken it down into small pieces and spiced it up with some tips along the way, so that you can set up your own reporting measures in Analytics on your own, here.
We hope these tools can help you showcase your marketing muscles to the boss, and feel like a real hero when the next marketing budget is to be presented.
Good luck!


